Better call Thomas – Bayes in the Database

This is my third and last post covering my presentations from last week’s Tech Event, and it’s no doubt the craziest one :-).
Again I had the honour to be invited by my colleague Ludovico Caldara to participate in the cool “Oracle Database Lightning Talks” session. Now, there is a connection to Oracle here, but mainly, as you’ll see, it’s about a Reverend in a Casino.

So, imagine one of your customers calls you. They are going to use Oracle Transparent Data Encryption (TDE) in their main production OLTP database. They are in a bit of panic. Will performance get worse? Much worse?

Well, you can help. You perform tests using Swingbench Order Entry benchmark, and soon you can assure them: No problem. The below chart shows average response times for one of the transaction types of Order Entry, using either no encryption or TDE with one of AES-128 or AES-256.
Wait a moment – doesn’t it even look as though response times are even lower with TDE!?

Swingbench Order Entry response times (Customer Registration)

Well, they might be, or they might not be … the Swingbench results include how often a transaction was performed, and the standard deviation … so how about we ask somebody who knows something about statistics?

Cool, but … as you can see, for example, in this xkcd comic, there is no such thing as an average statistician … In short, there’s frequentist statistics and there’s Bayesian, and while there is a whole lot you can say about the respective philosophical backgrounds it mainly boils down to one thing: Bayesians take into account not just the actual data – the sample – but also the prior probability.

This is where the Reverend enters the game . The fundament of Bayesian statistics is Bayes theorem, named after Reverend Thomas Bayes.

Bayes theorem

In short, Bayes Theorem says that the probability of a hypothesis, given my measured data (POSTERIOR), is equal to the the probability of the data, given the hypothesis is correct (LIKELIHOOD), times the prior probability of the hypothesis (PRIOR), divided by the overall probability of the data (EVIDENCE). (The evidence may be neglected if we’re interested in proportionality only, not equality.)

So … why should we care? Well, from what we know how TDE works, it cannot possibly make things faster! In the best case, we’re servicing all requests from the buffer cache and so, do not have to decrypt the data. Then we shouldn’t incur any performance loss. But I cannot imagine how TDE could cause a performance boost.

So we go to our colleague the Bayesian statistian, give him our data and tell him about our prior beliefs.(Prior belief sounds subjective? It is, but prior assumptions are out in the open, to be questioned, discussed and justified.).

Now harmless as Bayes theorem looks, in practice it may be difficult to compute the posterior probability. Fortunately, there is a solution:Markov Chain Monte Carlo (MCMC). MCMC is a method to obtain the parameters of the posterior distribution not by calculating them directly, but by sampling, performing a random walk along the posterior distribution.

We assume our data is gamma distributed, the gamma distribution generally being adequate for response time data (for motivation and background, see chapter 3.5 of Analyzing Computer System Performance with Perl::PDQ by Neil Gunther).
Using R, JAGS (Just Another Gibbs Sampler), and rjags, we (oh, our colleague the statistian I meant, of course) go to work and create a model for the likelihood and the prior.
We have two groups, TDE and “no encryption”. For both, we define a gamma likelihood function, each having its own shape and rate parameters. (Shape and rate parameters can easily be calculated from mean and standard deviation.)

model {
    for ( i in 1:Ntotal ) {
      y[i] ~ dgamma( sh[x[i]] , ra[x[i]] )
    }
    sh[1] <- pow(m[1],2) / pow(sd[1],2)
    sh[2] <- pow(m[2],2) / pow(sd[2],2)
    ra[1]  <- m[1] / pow(sd[1],2)
    ra[2]  <- m[2] / pow(sd[2],2
    [...]

Second, we define prior distributions on the means and standard deviations of the likelihood functions:

    [...]
    m[1] ~ dgamma(priorSha1, priorRa1)
    m[2] ~ dgamma(priorSha2, priorRa2)
    sd[1] ~ dunif(0,100)
    sd[2] ~ dunif(0,100)
  }

As we are convinced that TDE cannot possibly make it run faster, we assume that the means of both likelihood functions are distributed according to prior distributions with the same mean. This mean is calculated from the data, averaging over all response times from both groups. As a consequence, in the above code, priorSha1 = priorSha2 and priorRa1 = priorRa2. On the other hand, we have no prior assumptions about the likelihood functions’ deviations, so we model them as uniformly distributed, choosing noninformative priors.

Now we start our sampler. Faites vos jeux … rien ne va plus … and what do we get?

Posterior distribution of means

Here we see the outcome of our random walks, the posterior distributions of means for the two conditions. Clearly, the modes are different. But what to conclude? The means of the two data sets were different too, right?

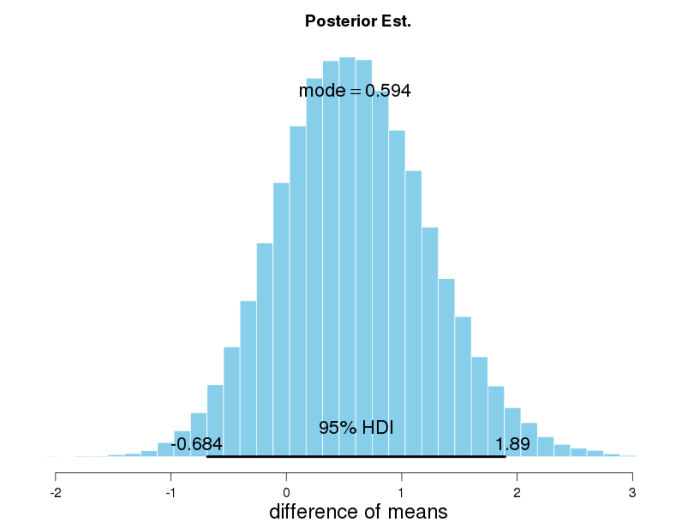
What we need to look at is the distribution of the difference of both parameters. What we see here is that the 95% highest density interval (HDI) [3] of the posterior distribution of the difference ranges from -0.69 to +1.89, and thus, includes 0. (HDI is a concept similar, but superior to the classical frequentist confidence interval, as it is composed of the 95% values with the highest probability.)

Posterior distribution of difference between means

From this we conclude that statistically, our observed difference of means is not significant – what a shame. Wouldn’t it have been nice if we could speed up our app using TDE 😉

Tune the App, Not the SQL – DBA Sherlock’s Adventures in Hibernate/jOOQ Land

Last weekend at Trivadis Tech Event, in addition to my session on Oracle 12c Client High Availability for Java (Application Continuity, Transaction Guard … choose your degrees of freedom”), I gave a quite different talk called Tune the App, Not the SQL – DBA Sherlock’s Adventures in Hibernate/jOOQ Land”.

In a nutshell, what is it all about? Well, if you’re a DBA, you might sometimes (or often, or seldom – depends on your job ;-)) do what we call “SQL Tuning”. It might look like this: You get a call that the application “is slow”. Fortunately, you’re able to narrow that down quickly, and it’s just “the click on that button” that is slow. Fortunately, too, the application is well instrumented, and getting traces for specific tasks is not a problem. So you get a SQL trace file, run tkprof on it, and obtain the problematic SQLs in order of elapsed time. Then you analyse the “Top SQL”. You may find it should be rewritten, or that it would benefit from an index. Perhaps adding additional data structures might help, such as creating a materialized view. Perhaps you’re unlucky and just an ugly hint will fix it.

So you tell the developers “please rewrite that, like this”, or you create that index. And after, it’s waiting and hoping that performance will improve – noticeably, that is. Because tuning that single statement might – if you’re unlucky – not make that much of a difference.

There is, however, another approach to tuning application performance (always talking about the DB related part of it here, of course), and that has to do with the application logic and not single statements. There is an excellent demonstration of this in Stéphane Faroults very recommendable book “Refactoring SQL applications”, in fact, this is right at the beginning of the book and something that immediately “draws you in” (it was like that for me :-)).

Application logic affects what, when, and how much data is fetched. Of course, there are many aspects to this – for example, it just may not be possible to replace two DB calls by one simply because another service has to be queried in between. Also, there will have to be a tradeoff between performance and readability/maintainability of the code. But often there will be a choice. And you will see in the presentation it is not always that combining two queries into one results in better performance.

In fact, it all depends. So the first conclusion is the ubiquitous “don’t just assume, but test”.

There is another aspect to this, though. While Stéphane Faroult, in his test case, uses plain JDBC, I am using – and comparing, in a way – two commonly used frameworks: Hibernate and jOOQ. (For an “interdisciplinary introduction” to Hibernate, see my talk from previous Tech Event, Object Relational Mapping Tools – let’s talk to each other!. Quite a contrast, jOOQ is a lightweight, elegant wrapper framework providing type safety and near-100% control over the generated SQL.)

Now while for a DBA looking at a raw trace file, it will always be a challenge to “reverse engineer” application logic from the SQL sent to the database (even if plain JDBC or jOOQ are being used), the difficulties rise to a new dimension with Hibernate :-). In the talk, I am showing a DBA – who doesn’t need to be convinced any more about the importance of application logic – trying to make sense of the flow of statements in a trace file: the only information he’s got. And it turns out to be very difficult …

But as he’s not just “some DBA”, but Sherlock, he of course has his informants and doesn’t remain stuck with his DB-only view of the world – which brings me to one of my ceterum censeo’s, which is “DBAs and developers, let’s talk to each other” :-).

The slides are here.

Oracle 12c Transaction Guard, Application Continuity … choose your degrees of freedom!

Last Saturday at Trivadis Tech Event, I presented on Application Continuity, Transaction Guard … choose your degrees of freedom”.
What a strange title, you will be asking! What do Application Continuity (AC) and Transaction Guard (TG) have to do with freedom 😉
And why talk about Transaction Guard, isn’t that just a technology used by AC? Surely it’s not something you would care to implement – if the language you’re working with is Java?

Well, there are – in addition to the extensive, but not really easy to digest Oracle documentation – some very helpful resources (blog articles, presentations) on the net, but these mostly focus on infrastructural aspects: How does AC work with RAC, with Data Guard, with RAC One Node? What does the DBA have to do to enable AC (or TG)?

The demos are mostly designed to demonstrate that AC “just works”, in different environments. As the client code is not in focus, often the easiest way of implementing AC on the client is chosen: using Oracle Universal Connection Pool (UCP). (I’ve encountered one notable exception, which is Laurent Leturgez’ very interesting post on AC resource usage.)

However, in real life, much will depend on the developer teams: Are they comfortable with making the necessary modifications? Do they trust the technology? What if they, for whatever reasons, use their own connection pool, and so can’t use UCP?

In this presentation, the focus is on the developers’ part. How the code looks / might look, and what pitfalls there are – what errors you might see if you don’t do it right, and what they mean. This is for both AC and TG.

Let’s assume, however, that you’re VERY impatient and just want to know what the “main thing” is here 😉 … I’d say it’s about TG.

As of today, I’m not aware of any Java code on the web implementing TG that is NOT from Oracle documentation / whitepapers. Of course, as the topic is not easy and probably a bit “scary”, we are thankful for the example code Oracle provides. In Transaction Guard with Oracle Database 12c Oracle provide the following code example, which shows how it works:


Connection jdbcConnection = getConnection();
boolean isJobDone = false;
while(!isJobDone) {
    try {
        updateEmployeeSalaries(jdbcConnection);
        isJobDone = true;
    } catch (SQLRecoverableException recoverableException) {
    try {
        jdbcConnection.close();
    } catch (Exception ex) {}
    }
    Connection newJDBCConnection = getConnection();
    LogicalTransactionId ltxid = ((OracleConnection)jdbcConnection).getLogicalTransactionId();
    isJobDone = getTransactionOutcome(newJDBCConnection, ltxid);
    jdbcConnection = newJDBCConnection;
  }
}

Basically we have a loop around our transaction. Normally that loop is left immediately. But in case we receive a recoverable exception, we get a new connection, obtain the Logical Transaction ID from the dead connection, and ask the database server for the transaction outcome for that LTXID. If the commit went through successfully, we’re done, otherwise we resubmit our transaction.

Now while this demonstrates how to do it, we do not want to clutter our code like this everywhere, do we? And fortunately, with Java 8, we don’t have to!

In Java 8, we have Functional Interfaces. Formally, a functional interface is an interface with exactly one explicitly declared abstract method. This abstract method can be implemented directly inline, using a lambda expression. That is, the lambda expression IS an implementation of the functional interface.

This allows us to separate transaction handling from the business methods, and get rid of the above loops. How?

On the one hand, this is how one business method could look:


private void updateSalaries(Connection conn) throws SQLException {
    String query = "select empno, sal from tg.emp";
    PreparedStatement stmt = conn.prepareStatement(query, ResultSet.TYPE_SCROLL_SENSITIVE, ResultSet.CONCUR_UPDATABLE);
    ResultSet rs = stmt.executeQuery();
    while (rs.next()) {
       int oldsal = rs.getInt("sal");
       int newsal = calculateNewValue(oldsal);
       rs.updateInt("sal", newsal);
       rs.updateRow();
    }
    rs.close();
    stmt.close();
}

On the other, here we have a functional interface:

@FunctionalInterface
public interface Transaction {
    public void execute(Connection connection) throws SQLException;
}

One implementation of a transaction can be a lambda expression that wraps the updateSalaries business method, like this: (conn -> updateSalaries(conn)):

TGTransactionProcessor tp = new TGTransactionProcessor(url, appUser, appPasswd);
    if (tp.process(conn -> updateSalaries(conn))) {
        logger.fine("Salaries updated.");
    }


public boolean process(Transaction transaction) throws SQLException {

    boolean done = false;
    int tries = 0;
    Connection conn = getConnection();

    while (!done && tries <= MAXRETRIES) {

        try {

            transaction.execute(conn);
            conn.commit();
            conn.close();
            done = true;

        } catch (SQLRecoverableException e) {

            try {
                conn.close();
            } catch (Exception ex) {
           }
            LogicalTransactionId ltxid = ((OracleConnection) conn).getLogicalTransactionId();
            Connection newconn = getConnection();
            setModule(newconn, moduleName);
            done = isLTxIdCommitted(ltxid, newconn);
            if (done) {
                logger.info("Failed transaction had already been committed.");
           } else {
                logger.info("Replay of transaction neccessary.");
               tries++;
               conn = newconn;
           }

        }
    }
    return true;
}

So with Java 8 Functional Interfaces, we have an elegant way to separate business logic and transaction handling in general, and implement TG in Java, specifically.
So that’s the end of the “highlights of” section, for more information just have a look at the slides :-).

Overhead of TDE tablespace encryption, is there?

Recently, for a customer, I conducted performance tests comparing performance under TDE tablespace encryption to a baseline. While I won’t present the results of those tests here I will describe two test series I ran in my lab environment.
So you’re an application owner – or a cautious DBA who wants to avoid trouble 😉 – and you want to know, is there an overhead if you use TDE tablespace encryption? (I think there’s some material available on this and I think it rather goes in the “no difference” direction. But it’s always nice to test for yourself, and you really need an answer – yes or no? ;-)).

For both test series, the design was the same: 2*3-factorial with factors

  • encryption: none, AES 128, AES 256, and
  • absence/presence of AES-NI kernel module (on suitable hardware)

So let’s see…

No there’s not!

The first test series were runs of the widely used Swingbench Order Entry Benchmark.
Measurement duration (excluding warm-up) per condition was 20 minutes, which was enough – in this isolated environment – to get reproducible results (as confirmed by sample).
The setup and environmental characteristics were the following:

  • Oracle 12.1.0.2 on OEL 7
  • Order Entry schema size 6G
  • SGA 3G
  • 2 (v)CPUs
  • Data files on ASM
  • 4 concurrent users

Let’s look at the results:

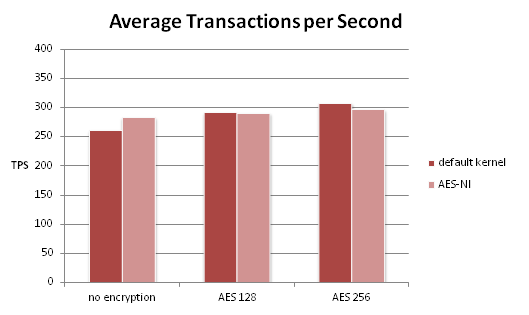
Swingbench OE TPS

At first, it even looks like test runs using encryption had higher throughput. However, with standard deviations ranging between 25 and 30, for the single Order Entry transaction types, this must be attributed to chance. (Also, it would be quite difficult to argue why throughput would actually increase with TDE… let alone be highest when using an algorithm that requires more rounds of encryption…)
So from this test series, we would conclude that their is no performance impact of TDE tablespace encryption. But then, most of the time, at this ratio of schema size to buffer cache, blocks are mostly found in the cache:

  • Logical read (blocks) per transaction: 105.9
  • Physical read (blocks) per transaction: 2.6
  • Buffer Hit %: 97.53

Now with TDE tablespace encryption, blocks are stored in the SGA unencrypted, which means only a process that has to get the block from disk has to perform decryption.
Encryption, on the other hand, is taken care of by database writer, and so happens in the background anyway. So in this setup, it’s not astonishing at all not to find throughput differences due to absence/presence of encryption.

Yes there is…

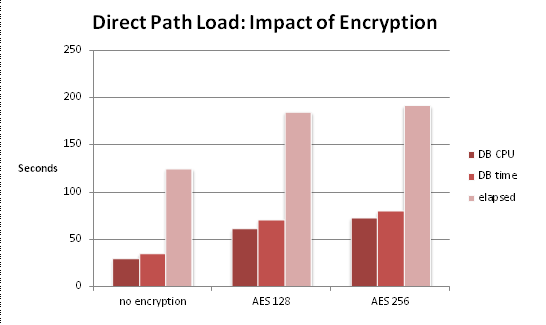
A second type of test was run against the same database, on the same host. These were SQL Loader direct path loads of a 14G file, done serially. In this case, the server process has to read every line from disk, encrypt it, and write it to disk. This is what we see in this case:

SQL Loader Direct Path Load times

Now suddenly we DO have a substantial impact of TDE. Loading the file and storing data to disk now takes ~1.5 times as long as without encryption. And we see – which was to be expected, too – that this increase in elapsed time is mostly due to increased cpu consumption.

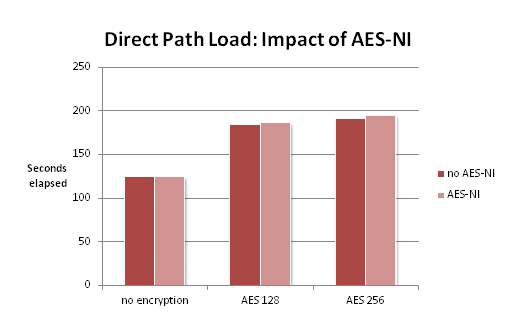
By the way, now that we have such a clear effect, do we see usage of AES-NI speeding up the load? No:

SQL Loader Direct Path Load, with and without AES-NI

This is surprising and probably something deserving further investigation, but not the topic of this post…

Conclusion

So what’s the point? Whether or not you will experience negative impact on performance will depend on your workload. No simple yes-or-no here… (but of course, no mystique either. It just means we have to phrase our questions a little bit more precisely.)

Raising the Fetch Size, Good or Bad? Memory Management in Oracle JDBC 12c

Yesterday at DOAG I presented on “Raising the Fetch Size, Good or Bad? Memory Management in Oracle JDBC 12c”.
Again I’m too lazy to write a separate post (okay, let’s phrase this positively: I don’t like to be redundant ;-)) so I’ll just say what’s not in the slides …

Firstly, it all started with a story, a story about an Oracle DBA for whom, like for most any Oracle DBA I guess, fetch size was a well-known tuning knob. Most any Oracle DBA, I think, will have read some blog post on this topic, or seen a demo showing that as we raise the fetch size, throughput goes up. In fact, sometimes you can see it going up very much!

And so in one company, there was a DBA who decided to do systematic experiments, in order to find out the optimal fetch size for the in-house application. As it turned out, the optimal value for that application lay around 80. So the DBA told the developers, it was integrated into the code, and released to pre-prod. All was fine or at least nobody said the opposite.

Then inevitably, there came the day of the production release, and all wasn’t fine any more … The application server kept crashing with out of memory errors, and they had to do an emergence release, and no-one never ever wanted to talk about this any more.
What had happened? How could a value of 80 (we’re not speaking 10000 here) have such a catastrophic effect?

So that’s for the teaser… now there’s an Oracle Whitepaper where they describe how memory management in the JDBC driver was fundamentally changed between 11g and 12c. Will it be enough to read this paper, for people who have experienced those OOM errors, to be willing to try it again?
My idea was to perform an experiment and see for myself. And that’s what the talk was about, – how I set up the experiment and what was the outcome ;-). Here are the slides.

Wanted: Your Take on the Cy Bernetic Optimizer (CBO)

This is not really a technical blog post, it’s an invitation to discuss something. The “something” is what Tony Hasler calls “The Strategic Direction for the CBO”.
Short time ago I started reading his – very much worth reading, very entertaining, too – book on “Expert Oracle SQL”, where without much ado he says, regarding that direction:

Despite the concerns about predictability that customers started raising from the outset and continue to raise today, the strategic direction of the CBO continues to be based on adaptability. Features like dynamic sampling and bind variable peeking started to appear. When 11g arrived it became very clear that the CBO team was looking towards ever more adaptable and ever less predictable behaviors. The signals came in the form of Adaptive Cursor Sharing in 11gR1 and Cardinality Feedback in 11gR2. […] As if this wasn’t bad enough, 12cR1 introduced Adaptive Execution Plans. This feature might result in the execution plan of a statement changing in mid-flight! We don’t want these features!

(See below for a longer quotation, providing more context).

I found this very interesting – normally what you see is people getting annoyed with / frustrated by / furious over

  • the bugs accompanying these new features,
  • those execution plan changes that are (1) for the worse and (2) get noticed by users (or monitoring systems),

and the new features are getting disabled, at a varying granularity, after a varying amount of analysis/troubleshooting.
(As of today, what percentage of systems upgraded to 12c might be running with optimizer_adaptive_features turned off?).

But this is not about bugs or even how well it works, but about the “principle”. Assume they worked fine, performance was for the better most all the time – how would you like these optimizer self-tuning features?

Here is the Tony Hasler citation again, the complete paragraph this time:

One of the key things about the old Rule-Based Optimizer (RBO) was that the same statement resulted in the same execution plan every time. The CBO, on the other hand, is designed to be adaptable. The CBO tries to get the optimal execution plan each and every time, and if the object statistics suggest that the data has changed then the CBO will quite happily consider a new execution plan.
Despite the concerns about predictability that customers started raising from the outset and continue to raise today, the strategic direction of the CBO continues to be based on adaptability. Features like dynamic sampling and bind variable peeking started to appear. When 11g arrived it became very clear that the CBO team was looking towards ever more adaptable and ever less predictable behaviors. The signals came in the form of Adaptive Cursor Sharing in 11gR1 and Cardinality Feedback in 11gR2. Both Adaptive Cursor Sharing and Cardinality Feedback can result in the execution plan selected for the first execution of a statement being “upgraded” for the second and subsequent executions, even with no change to object statistics! Usually, these changes are for the better, but there are no guarantees.
As if this wasn’t bad enough, 12cR1 introduced Adaptive Execution Plans. This feature might result in the execution plan of a statement changing in mid-flight! We don’t want these features!
– On a test system we don’t want these features because they might mask problems that will impact our production service.
– On a production system we don’t want these features because the execution plans that we have tested are satisfactory, whatever the CBO thinks; we don’t want to risk using an untested plan that might cause performance to degrade.

With the above argumentation, convincing though it sounds, I have two concerns, which in the end are closely interrelated.

First, the “real world” one. There are, of course, many real worlds, but in how many of them is it that the teams of software developers and DBAs, collaborating closely, after thorough, institutionalized testing on the integration systems, can say: Our new code introduced those new execution plans, they are good (or even the best possible), we can safely release our code in production?
One real world I know is where developers develop, and DBAs are busy patching, upgrading databases, working around necessary OS upgrades, providing test systems, and ex- and importing data – only dealing with SQL performance if and when problems arise.

There is this section in the book about a Connor McDonald presentation culminating in

Of course the fictitious execution plan changed was caused by an explicitly run job to gather statistics. No authorization, no impact analysis, no testing, nothing. Connor asked the perfectly reasonable question as to why IT organizations routinely precipitate untested execution plan changes on their database systems while at the same time placing most other types of changes under the highest scrutiny. It seemed to Connor that that the world had gone mad. I agree!

(I told you the book was fun to read.) Now of course the world is mad, but it’s easy to understand the human and organizational factors leading to this special thing. Colors, phrasings, menus on a website are more tangible than execution plans, for one … But that’s another discussion.

So in a practical way, I imagine there’s an idea of easing the DBA’s job because anyway, her job is complex, and getting more complex – in an infrastructure way – all the time (think of the whole Big Data integration topic coming up).

So that leads to the second point. If the intention is to ease the DBA’s job, instead of making it more difficult, introducing problems etc., then adaptivity, or machine learning, sounds like a good idea. With supervised learning, me the DBA, I have analyzed a statement, know the best solution and tell the optimizer how to run it. With unsupervised learning, the optimizer finds out itself.
If we agree that a self-learning optimizer may be a good thing, the question is good are its methods/algorithms? Not in the way of “are they buggy”, but are they, in principle, good techniques that, when bugs have been removed, fulfill their purposes?

Many of the features concerned, and mentioned by Tony Hasler, are based on feedback loops. (That’s the reason for the cybernetic in the post’s title). Being based on feedback loops can mean one of two things here:

  • The feedback occurs after execution is complete. This means there was at least one bad execution. (In practice there may have been more). This is the case for Adaptive Cursor Sharing and Cardinality Feedback.
  • The feedback occurs mid-execution, as with 12c Adaptive Plans.

With the second form, in principle (again, bugs aside), I don’t have an issue. Join cardinality estimation is intrinsically difficult (just read up on Jonathan Lewis’ blog for that) – now you could either try to find a better generic, one-fits-all-and-handles-every-case algorithm, or you approach the question from another side – such as a control mechanism like the STATISTICS_COLLECTOR rowsource.

As for the first form, you (here meaning the software vendor, i.e., Oracle) could do several things to make it better.

  • Re-engineer the underlying algorithm so that fewer failures are needed before the good plan is found.
  • Persist the results, so we don’t start again from zero after the information (the cursor) is flushed from the shared pool.
  • Ideally, not even a single failure were needed – this is the same as conversion to the second form.

Now for improving the algorithms, this is I guess what’s happening between releases (I don’t have a testcase available, but I’d assume it could be shown for e.g. Adaptive Cursor Sharing between 11.1 and 12.1); for persisting results, look at the evolution from 11.1 cardinality feedback to 12.1 inclusion of that information (now renamed to “statistics feedback”) in SQL Plan directives; for converting to an in-flight algorithm, this may be feasible or not. If it’s feasible, it may still not be efficient.

Summing up, the direction seems to be “unsupervised learning, using mid-execution feedback / zero failure adaptive behavior where possible”. This does not look too bad to me. (By the way I’m not even sure that in the best (in-flight) form, this goes against testability as argued by Tony. 12c adaptive join methods use a deterministic inflection point calculation that should allow for reproducible tests given identical data.)

Did you notice the word “strategic” in the above quotation? Further down in the same chapter, Tony writes, with respect to SQL Plan Management

Although the CBO strategy is all about adaptability, Oracle, like any other company, has to do something to address the demands of its largest and most vocal customers. Here are the tactical plan stability measures that Oracle has taken to address customer concerns about predictability.

So there we have the strategy vs. tactics opposition. But do we necessarily need to see it like this? In the view I’m suggesting, of supervised vs. unsupervised learning, as long as SQL Plan Management goes “unattended” it is not fundamentally in contradiction to the adaptive features. With 12c SPM Evolve Advisor Task, this would be the case.

One digression before I wrap it up. Tony has another very interesting paragraph, about Graham Wood on frequency of statistics gathering:

In 2012 the Real World Performance team from Oracle did a round-the-world tour to try to dispel some myths about Oracle performance and to educate people about performance management. I attended the Edinburgh seminar and found it very stimulating. One of the most interesting suggestions came from Graham Wood. Graham’s observation was that many of Oracle’s customers gather statistics far too frequently. I want to make it clear that Graham did not say that gathering statistics was only required to prevent execution plan changes, and he most definitely didn’t liken gathering statistics to a game of Russian Roulette! However, Graham’s recommendation does suggest, quite correctly, that there is some risk to gathering statistics and that by doing it less often you can reduce that risk considerably.

The risk of statistics calculation refers to DBA_TAB_COL_STATISTICS.LOW_VALUE and DBA_TAB_COL_STATISTICS.HIGH_VALUE which when increasingly off will lead to increasingly wrong cardinality estimations (imagine having collected statistics at 10 P.M. and loading fresh, time-based data during the night – again read up on Jonathan Lewis’ blog for that topic). Here I must say this suggestion – don’t gather statistics too often – does not seem in line to me with the “general direction”. If I’m to trust Oracle to achieve good results with the “unsupervised learning approach”, I want to be able to assume this issue to be handled automatically, too – which would mean for Oracle to look into the algorithm related to how HIGH_VALUE and LOW_VALUE are used in cardinality estimation (introduce something like dynamic sampling here? in specific cases?).

So, that was my try on a take on that topic. What do you think? Do you agree with Tony that “we don’t want that”, or do you see value in the “unsupervised learning” approach? Please feel free to leave a comment to share your opinion!

Object Relational Mapping Tools – let’s talk to each other

Following up with the follow up of Trivadis Tech Event :-).
In addition to the five minute talk about Linux Tracing for Oracle, I presented on a quite different subject: “Object Relational Mapping Tools – let’s talk to each other”.
My original intention was to write 2 – 3 successive posts on the subject, but as always, time’s scarce and so I’ve decided to just upload the presentation, see here.

But allow me some words on the background. A database admin (though spare time coder, too ;-)), presenting on O/R Mappers? How could that be? At least then, these performance killers should really get pulled to pieces, right?
Well, no. They aren’t. Instead, my intentions have been the following:

  • Explain to a DBA audience why developers might want to use them.
  • Explain – to DBAs and developers both – what are probable difficulties, on a conceptual level (the infamous “Object-Relational Impedance Mismatch”)
  • Explain – again on a conceptual level, but with concrete examples, and to both audiences, too – what to watch out for when fetching data (i.e., doing SELECTs as opposed to data manipulation).

“What to watch out for” – this has actually been the talk’s main purpose. (I plan to follow up with load tests / “real empirical stuff” at a later time).
And how about the “let’s talk to each other”? You may have guessed already …

Peeking into Oracle using Linux tracing tools – five tools in five minutes

Five tools in five minutes?

What’s that supposed to mean, you will be asking! Well, one week ago at Trivadis Tech Event, I had the honor of being invited to participate in the Oracle Lightning Talks session organised by my colleague Ludovico Caldara, where every topic has to be presented in five minutes (which of course makes for quite an interesting “listening experience” for the audience …).
To sort of “maximize the mismatch”, I chose to present on Linux tracing tools – not one (normally you’d need hours to explain just one) – but five, one for every minute 😉

So here’s my personal list of appetizers, you’ll find some links at the end to really get you started:

strace

So, strace, you will be thinking, that sounds a bit boring, doesn’t it? Well, perhaps, but it’s a good tool to start an investigation. Oracle has its “wait event lingo”, – but what’s going on underneath?
Here for example, we’re stracing the CKPT process, who says he’s doing a control file parallel write. With strace we can see the asynchronous IO request it issued (io_submit), the two file descriptors it was issued to, and how the process waits for completion in a blocking IO call (io_getevents):

$ strace -tt -f -e write=all -v -s 100 -p $(pgrep ora_ckpt)

So strace can be useful, but beware, it will slow down the process being traced – check out Brendan Gregg’s post “Strace Wow Much Syscall” (nice title isn’t it ;-)) listed in the appendix. Speaking of whom …

https://github.com/brendangregg/perf-tools

… Brendan Gregg has a very nice collection of scripts on github, following the unix/linux philosophy, “one tool one purpose”.
Here, for example, I’m using iolatency to get a meaningful representation of IO latencies to a voting disk on one of my VMs:

$ lsblk/dev/vdb
$ ./iolatency –d 251,16

Or check out execsnoop, which shows newly created processes on the system – just watch how clusterware is constantly monitoring itself and others …

$ ./execsnoop

Useful little scripts, you could write them yourself!
Just have a look at what’s to be discovered in …

The /proc filesystem

Its content doesn’t always come as nicely formatted as the /proc/meminfo us DBAs are used to using ;-), but it may be possible to look in the kernel source to figure out what it means… For example, you might look in fs/proc/stat.c to figure out this:

$ cat /proc/stat

And perhaps even more helpful, we have lots of per-process information under /proc/<pid>/.
For example, process memory mappings, like this one here of the Oracle log writer:

$ cat /proc/$(pgrep ora_lgwr)/maps

Ok. Two left, time for the big shots… Enter –

perf

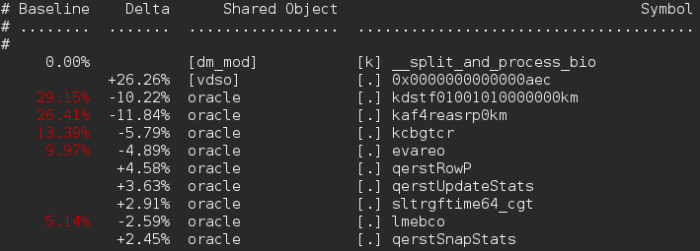
Perf has many uses, but one of the most frequent probably is sampling on-cpu functions. Say I want to determine how much overhead it is setting statistics_level to all.
I‘m executing a simple two-table join, first with statistics_level set to all, and then, with statistics_level set to typical, and for both, I sample what runs on cpu using perf. The result: not much of a difference!

$ perf record -p  -o all_hj.data sleep 30
$ perf record -p  -o typ_hj.data sleep 30
$ perf diff typ_hj.data all_hj.data

Well. Oracle was doing a hash join. Now I do the same, forcing a nested loop join, what happens?

$ perf record -p  -o all_nl.data sleep 30
$ perf record -p  -o typ_nl.data sleep 30
$ perf diff typ_nl.data all_nl.data

Oracle spends 26% of the time in a vdso call, getting the current time from the operating system!

That‘s just one example of what you can do with perf, there’s numerous others – and possibly an even more amazing tool is …

systemtap

Using systemtap, I can profile user-space (here: Oracle) functions.
This all builds upon the awesome investigations of two guys, Luca Canali and Frits Hoogland, whose work you will find linked in the appendix.
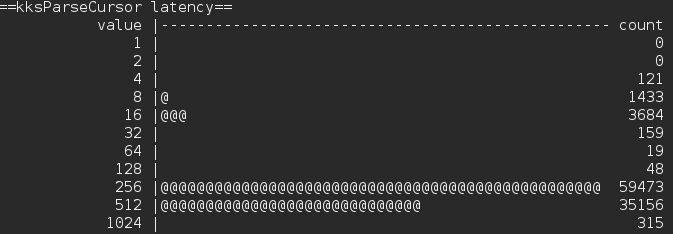
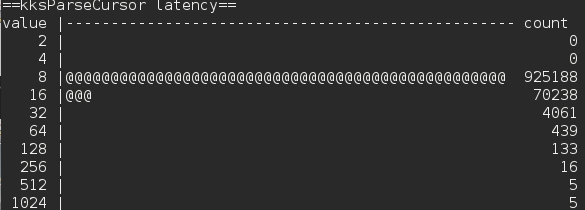
So say I’d like compare two versions of a Java program, one hard parsing all the time (using plain java.sql.Statement) and another that uses bind variables (by means of java.sql.PreparedStatement). What are they doing „under the hood“, and how long do these operations take?

This is one thing I could do: get a latency histogram of the Oracle function kksParseCursor. First, the case of doing a hard parse every time: Most parses take between 128 and 512 ms.

Then we have the code using bind variables – most parses take less than 8 ms here…

Again, this is just a starting point … possibilities are endless. So to get you started, have a look at the appendix, and: enjoy!

Appendix: What to Read

System Tap into Oracle for Fun and Profit
Life of an Oracle I/O: Tracing Logical and Physical I/O with SystemTap
Linux strace doesn’t lie after all.
How long does a logical IO take?
strace Wow Much Syscall
perf Examples

Write your own Swingbench transaction

Are you using – or planning to use – Swingbench?
Swingbench currently provides four different benchmarks, the most well-known being Order Entry, a TPC-C like benchmark based on the Oracle-shipped oe schema.
In its default configuration, Order Entry’s SELECT-INSERT-DELETE ratio is 50% – 30% – 20% (as documented in http://dominicgiles.com/swingbench/swingbench22.pdf).
Order Entry is highly customizable, you can modify the composing transactions’ weights and activate up to three more datawarehouse-like transactions that are not “on” by default. Still, depending on what you need to test, you might find that even by carefully choosing your transactions you cannot generate the kind of activity required.
In that case, it’s possible to write your own transactions.

Adapting the build is easy and well documented in the FAQs. What I’d like to do here is give a very basic code example, stripped down to the requirements of integration into the Swingbench framework and performing a basic JDBC action.

I’ll break the code up in pieces first; a complete listing will be found at the end of the post.

A basic Swingbench transaction

Swingbench transactions are written in Java. There are two types of transactions, found in two different subdirectories – those which simply use Java to call, and retrieve the results from, stored procedures and those which use JDBC to perform the distinct steps of parsing, executing and fetching.

Here I assume we need more control over single parts of this process (which is why we’re writing our own code in the first place, instead of varying, e.g., the size of the data), so we’re going to write a JDBC-based transaction.

First, the package declaration (surprisingly called mytransactions here) and the imports. Importing OracleConnection is only needed if you’d like to instrument the code for tracing. (Aside: using EndToEndMetrics is deprecated as of 12c, but to use DMS metrics – the recommended alternative – a special jar file, ojdbc_dms.jar, is required).

package com.dom.benchmarking.swingbench.mytransactions;

// the Swingbench framework
import com.dom.benchmarking.swingbench.kernel.DatabaseTransaction;
import com.dom.benchmarking.swingbench.event.JdbcTaskEvent;
import com.dom.benchmarking.swingbench.kernel.SwingBenchException;
import com.dom.benchmarking.swingbench.kernel.SwingBenchTask;

// java classes needed by either Swingbench or our own code
import java.util.Map;
import java.util.Random;
import java.util.logging.Logger;

// JDBC
import java.sql.Connection;
import java.sql.PreparedStatement;
import java.sql.ResultSet;
import java.sql.SQLException;

// Oracle JDBC (optional, needed by setEndToEndMetrics)
import oracle.jdbc.OracleConnection;

Next, the class declaration and some instance variables

// Extend DatabaseTransaction to use the Swingbench framework
public class FetchLotsOfData extends DatabaseTransaction {
  
  // add our own logging output to Swingbench's debug log
  private static final Logger logger = Logger.getLogger(FetchLotsOfData.class.getName());
  // Just one query here, I can put it outside of any methods
  private String query = "select * from mining_info where customer_id between ? and ?";
  
  private Random random = new Random();

All classes you write have to extend DatabaseTransaction to use the Swingbench framework. The JDBC transactions that come with Swingbench all extend OrderEntryProcess, a common superclass that provides much shared functionality. So if your test is going to run against the Swingbench-provided tables, and possibly using similar logic, check if you can make use of the functionality provided there. (In that case, in might make sense to put your class in the same package, instead of creating a separate one, or else you might have to change some instance variables to protected in OrderEntryProcess.java).
Here we’re not need to use any common helper methods and so, it is sufficient to extend DatabaseTransaction.

Now, every transaction has to implement three methods, init, execute, and close. Of these, you might just need execute, which is where you place the queries you want to be benchmarked.

The init method can be used for setup activities, e.g., getting data from the database (as in BrowseProducts.java) or reading initialisation files (as in NewCustomerProcess.java). The close method is not used in any of the provided transactions.

So here is our execute method, with comments. The JDBC action itself is kept deliberately simple here, as we’re focusing on the framework integration.

 
  public void execute(Map params) throws SwingBenchException {
    
    // get a connection; how Swingbench does this, is transparent for us
    Connection conn = (Connection)params.get(SwingBenchTask.JDBC_CONNECTION);
    // initialise the counters/metrics
    initJdbcTask();

    // setting the module so we can trace this on the server (optional)
    String metrics[] = new String[OracleConnection.END_TO_END_STATE_INDEX_MAX];
    metrics[OracleConnection.END_TO_END_MODULE_INDEX] = "FetchLotsOfData";
    
    // start measuring
    long executeStart = System.nanoTime();
    
    PreparedStatement stmt = null;
    ResultSet rset = null;
    
    try {
    
      ((OracleConnection) conn).setEndToEndMetrics(metrics, (short) 0);
      logger.fine("Preparing query: " + query);
      stmt = conn.prepareStatement(query);
      int low = random.nextInt(900);
      int high = low + 100;
      stmt.setInt(1, low);
      stmt.setInt(2, high);
      rset = stmt.executeQuery(); 
      
      String s;
      while (rset.next ()) {
	s = "Customer " + rset.getInt(1) + "(run " + rset.getInt(2) + "): " + "";
	// do something with s if you want
      }
      rset.close();
      
      // tell Swingbench we performed one select
      addSelectStatements(1);
      
      logger.fine("Result set closed.");
      stmt.close();
      logger.fine("Statement closed.");
      
      // tell Swingbench our execution time, and that execution was successful
      processTransactionEvent(new JdbcTaskEvent(this, getId(), (System.nanoTime() - executeStart), true, getInfoArray()));
      
    } catch (SQLException se) {
    
      se.printStackTrace();
      // tell Swingbench our execution time, and that we failed
      processTransactionEvent(new JdbcTaskEvent(this, getId(), (System.nanoTime() - executeStart), false, getInfoArray()));
      // re-throw the exception, Swingbench will display it - and the nested SQLException - on standard out
      throw new SwingBenchException(se.getMessage());
    
    } finally {
    
      // these two convenience methods are provided by Swingbench, they just catch the exceptions possibly thrown by closing
      // the statement / result set
      hardClose(rset);
      hardClose(stmt);
      
    }
  }

What’s important here is the exception handling. JDBC methods throw SQLException; this has to be handled while still keeping track of the stats.
In case the transaction was successful, we just call processTransactionEvent and proceed with the benchmark; otherwise we catch the exception, do the bookkeeping for a failed transaction, and rethrow the exception for Swingbench to handle as it sees fit (it will be displayed on the command line).
In both cases, we make sure the resources (ResultSet and Statement) are closed.

So that’s it – for you to implement more complex transactions :-). Here again is the complete class:

package com.dom.benchmarking.swingbench.mytransactions;

// the Swingbench framework
import com.dom.benchmarking.swingbench.kernel.DatabaseTransaction;
import com.dom.benchmarking.swingbench.event.JdbcTaskEvent;
import com.dom.benchmarking.swingbench.kernel.SwingBenchException;
import com.dom.benchmarking.swingbench.kernel.SwingBenchTask;

// java classes needed by either Swingbench or our own code
import java.util.Map;
import java.util.Random;
import java.util.logging.Logger;

// JDBC
import java.sql.Connection;
import java.sql.PreparedStatement;
import java.sql.ResultSet;
import java.sql.SQLException;

// Oracle JDBC (optional, needed by setEndToEndMetrics)
import oracle.jdbc.OracleConnection;

// Extend DatabaseTransaction to use the Swingbench framework
public class FetchLotsOfData extends DatabaseTransaction {
  
  // add our own logging output to Swingbench's debug log
  private static final Logger logger = Logger.getLogger(FetchLotsOfData.class.getName());
  // Just one query here, I can put it outside of any methods
  private String query = "select * from mining_info where customer_id between ? and ?";
  
  private Random random = new Random();
  public void execute(Map params) throws SwingBenchException {
    
    // get a connection; how Swingbench does this, is transparent for us
    Connection conn = (Connection)params.get(SwingBenchTask.JDBC_CONNECTION);
    // initialise the counters/metrics
    initJdbcTask();

    // setting the module so we can trace this on the server (optional)
    String metrics[] = new String[OracleConnection.END_TO_END_STATE_INDEX_MAX];
    metrics[OracleConnection.END_TO_END_MODULE_INDEX] = "FetchLotsOfData";
    
    // start measuring
    long executeStart = System.nanoTime();
    
    PreparedStatement stmt = null;
    ResultSet rset = null;
    
    try {
    
      ((OracleConnection) conn).setEndToEndMetrics(metrics, (short) 0);
      logger.fine("Preparing query: " + query);
      stmt = conn.prepareStatement(query);
      int low = random.nextInt(900);
      int high = low + 100;
      stmt.setInt(1, low);
      stmt.setInt(2, high);
      rset = stmt.executeQuery(); 
      
      String s;
      while (rset.next ()) {
	s = "Customer " + rset.getInt(1) + "(run " + rset.getInt(2) + "): " + "";
	// do something with s if you want
      }
      rset.close();
      
      // tell Swingbench we performed one select
      addSelectStatements(1);
      
      logger.fine("Result set closed.");
      stmt.close();
      logger.fine("Statement closed.");
      
      // tell Swingbench our execution time, and that execution was successful
      processTransactionEvent(new JdbcTaskEvent(this, getId(), (System.nanoTime() - executeStart), true, getInfoArray()));
      
    } catch (SQLException se) {
    
      se.printStackTrace();
      // tell Swingbench our execution time, and that we failed
      processTransactionEvent(new JdbcTaskEvent(this, getId(), (System.nanoTime() - executeStart), false, getInfoArray()));
      // re-throw the exception, Swingbench will display it - and the nested SQLException - on standard out
      throw new SwingBenchException(se.getMessage());
    
    } finally {
    
      // these two convenience methods are provided by Swingbench, they just catch the exceptions possibly thrown by closing
      // the statement / result set
      hardClose(rset);
      hardClose(stmt);
      
    }
  }

Book Review: Oracle SQL Tricks and Workarounds

Some time ago on oracle-l, someone asked for opinions regarding this book: Oracle SQL Tricks and Workarounds, by Zahar Hilkevich. As far as I know, no one knew the book (or felt like answering), and as I tend to think I know about the “books to read” in Oracle domains I’m interested in, I got curious. Plus, as a database administrator, I always have this bad conscience about not being fluent enough in SQL (What way round did it work again, connect by? How was the syntax for first_value again? … And I’m still grateful to another book – Advanced Oracle SQL Programming by Laurent Schneider – where I picked up such useful stuff as sys.odcivarchar2list…).
So I thought, I might as well get the book and write a review.

Unfortunately for me, as I do not like to criticize other people, this review will not be positive, and I was quite unsure should I really do it. Now that you read this, it’s clear how I decided, and that was for two reasons:
First, to offer people my opinion in case they’d like some buying advice, and second, more importantly, because what I think is not good about the book can be best illustrated by explaining how other approaches are better, and why, and how they do it, – which is probably the most interesting point here.

Now let me start with something positive: I do like the (intended) focus on creativity. (The question is, does the author’s method indeed result in more creative work).
Jumping right in, then, the first chapter is called “Terms and Definitions”, and here already things get strange – to put it politely. One terminological thing that bothers me may be a subjective reaction, possibly even related to my not being a native English or American speaker. The author explains how he had to choose a name for “the set of alternative solutions to a specific problem” and decided

“We call the family of distinct solutions for a given problem the workarounds for that problem.”

To me, workaround implies the existence of an obstacle, something I’ve had to work around… but well, this does not really matter, it is just a terminology thing.

Now the author has to come up with a criterion of what makes for a distinct solution, and here the decision does matter: Astonishingly, he chooses the execution plan (the plan hash value, to be precise):

“When we come up with a candidate solution, we examine its execution plan against the other solutions found so far. If it is different, we consider what we have found a new, distinct workaround; otherwise, we have only found a workaround equivalent to one of the other workarounds, which we also refer to as a synonymous workaround.”

Synonymous workaround (or solution)? In other words, things mean the same because they are executed the same way? This is a severe category error and must be incredibly confusing (and frustrating!) to SQL developers who lack any optimizer-related background knowledge. Say I rewrite my query completely, and still I get the same execution plan, – really? And then I execute it on another system, where a different Oracle version is running, and the plan is totally different? What’s the difference to trial and error? Nothing, as far as this book is concerned.

Let’s say I obtain a sizeable set of phrasings for my query, how do I decide which one is the best? In the predictive, explain plan style execution plans displayed in the book, all I may consider is the cost – may I rely on that? But choosing among different plans is not addressed by the author (guess I just execute and time the queries in my development environment ;-)). All that is addressed is how to enlarge my set of equivalent formulations.

Now, had the author just been content with showing different ways of writing SQL queries, not mixing in execution plans and pseudo-theoretic jargon, all would have been better or at least less confusing. (I also prefer – and am used to, from the “Oracle literature” in general – a much more modest style of writing, but I will not focus on that here). But given the author does show the explain plan for (just about) every rephrasing, at least he should have made some global comments about how these plans differ in general. But in the book, plans where a scan of some table is executed for every row of another table are not treated any different from plans where every table is scanned once – no ranking of plans, no comment, no nothing.

So we’re back to where I started, the “approach thing”. In a nutshell what this book does wrong is, in my opinion, to promote some sort of mechanical creativity while not providing insight. How do I get a query to run faster? I better start off with a lot of knowledge: How Oracle works, how the query optimizer works, what Oracle does with the query I’m passing in, how queries get transformed and why, how access paths are chosen and why… This is one kind of story (next to, e.g., the reverse engineering adventures) I always love reading on Jonathan Lewis’ blog: He knows what kind of execution plan, what access paths etc. he wants and then he rewrites and/or hints the query until he is there :-).

So optimizer and performance related knowledge is key, and for that, I totally recommend studying another book: Chris Antognini’s Troubleshooting Oracle Performance. Most readers will surely know the book, so I won’t add much more here, apart from it definitely being one of my “Oracle books to take on a lone island” if I were to choose 😉

Secondly, as we’re not talking about Oracle Performance in general, but SQL performance specifically, it certainly makes sense to work on specific techniques and methods (like analytic functions, set-based thinking, model clause etc) – and in general, to keep up with what’s going on, sql-wise, as new Oracle versions get out. In this domain, one book I liked and found instructive was Pro Oracle SQL.

Thirdly, a methodological approach may work, if it is based on criteria that really play a role in execution plans. Although I have no personal experience with it, it may be interesting to look into SQL Tuning, by Dan Tow, who bases his methods on relevant (single-table and join) selectivities.

Of course, this book list is not exhaustive, – the main point is, we have some wonderful, insight-providing books around in the Oracle Performance domain, there’s no need for trial-and-error if we want to be creative :-).